股票量化交易进阶003_回测框架backtrader(三)
前言
通过一些技能更深一步掌握backtrader框架
一、技能要点
1.如何获取一个line的长度
有两种不同的line的长度,一种是len,这个是backtrader已经处理过的数据的长度;一种是buflen(),这个是backtrader预先加载的数据的长度。
len(line):计算出backtrader已经处理(运行)的长度,如prenext,next等运行的长度
line.buflen()计算的是backtrader加载的line的总的数目
一般情况下,是buflen大于len,如果两者想等了,可能是这个bar是最后一个bar;也有可能是某些情况下的实盘交易造成的。
可以自行添加打印代码,看下实际情况:
 def next(self):
        self.bar_all = self.datas[0].close.buflen()
        self.bar_executed = len(self)
        print('===总共处理%s条bar,目前已处理了%s条' % (self.bar_all, self.bar_executed))
打印结果:
===总共处理1555条bar,目前已处理了1553条
2022-05-25, Close, 14.39
===总共处理1555条bar,目前已处理了1554条
2022-05-26, Close, 14.19
===总共处理1555条bar,目前已处理了1555条
2022-05-27, Close, 14.18
Final Portfolio Value: 513.35
2. line的延迟索引
self.data[0].close[-1] 操作符用于在next逻辑阶段提取值。
self.data[0].close(-1) 还代表什么呢?
Lines支持通过延迟索引来访问延时的Lines对象。
例如我们考虑一个策略,它对比前一收盘价和当前简单移动平均线值。除了可以在next迭代中手动执行,还可以在__init__阶段生成预处理的线对象:
class MyStrategy(bt.Strategy):
    params = dict(period=20)

    def __init__(self):

        self.movav = btind.SimpleMovingAverage(self.data, period=self.p.period)
        self.cmpval = self.data.close(-1) > self.sma

    def next(self):
        if self.cmpval[0]:
            print('Previous close is higher than the moving average')
这里就用到了Lines的延迟索引,通过self.data.close(-1)将close进行复制,并且做延时-1,生成了1个延迟的Lines对象。
3. backtrader的运算符
python的逻辑运算符都被Backtrader覆盖了,使其可以直接作用于线对象整体,进行矢量化运算
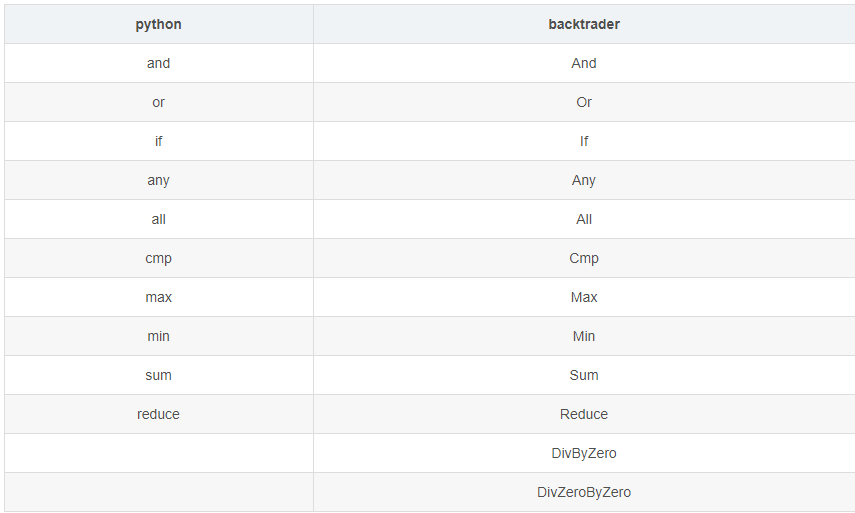
tips:
cmp(x,y) 函数用于比较2个对象,如果 x < y 返回 -1, 如果 x == y 返回 0, 如果 x > y 返回 1。
class MyStrategy(bt.Strategy):
    params = dict(period1=20, period2=25, period4=10, period3=5)

    def __init__(self):
        self.sma1 = bt.ind.MovingAverageSimple(
            self.data.close,
            period=self.params.period1
        )

        self.sma2 = bt.ind.MovingAverageSimple(
            self.sma1,
            period=self.params.period2
        )

        # 通过算数计算创建新指标线
        self.something = self.sma2 - self.sma1 + self.data.close

        self.sma3 = bt.ind.MovingAverageSimple(
            self.something,
            period=self.params.period3
        )
        self.something2 = self.sma3 - self.sma2 + self.data.close
        self.sma4 = bt.ind.MovingAverageSimple(
            self.something2,
            period=self.params.period4
        )
        self.greater = self.sma3 > self.sma1

        self.buysign = bt.And(self.sma1 > self.data.close, self.sma1 > self.data.high)
        self.high_or_low = bt.If(self.sma1 > self.data.close, self.data.low, self.data.high)
        self.high_or_30 = bt.If(self.sma1 > self.data.close, 30.0, self.data.high)
        # 生成开盘价除以收盘价形成的线,若某天的收盘价为0,则最终指标该日取 99999
        self.testIndicator = bt.DivByZero(self.data.open, self.data.close, zero=99999)
        # 若分母为0,则取8888;若分子分母都为0,取99999
        self.testIndicator2 = bt.DivZeroByZero(self.data.open, self.data.close, 8888, 99999)

    def next(self):
        if self.sma1[0] > 6.0:
            print('sma is greater than 6.0')

        if self.sma1[0] > self.data.close:
            print('sma is above the close price')

        if self.buysign[0]:
            print('buy sig is True')
        else:
            print('buy sig is False')

        if self.high_or_low[0] > 5.0:
            print('high_or_low is greater than 5.0')
打印结果:
sma is greater than 6.0
sma is above the close price
buy sig is False
high_or_low is greater than 5.0图表:
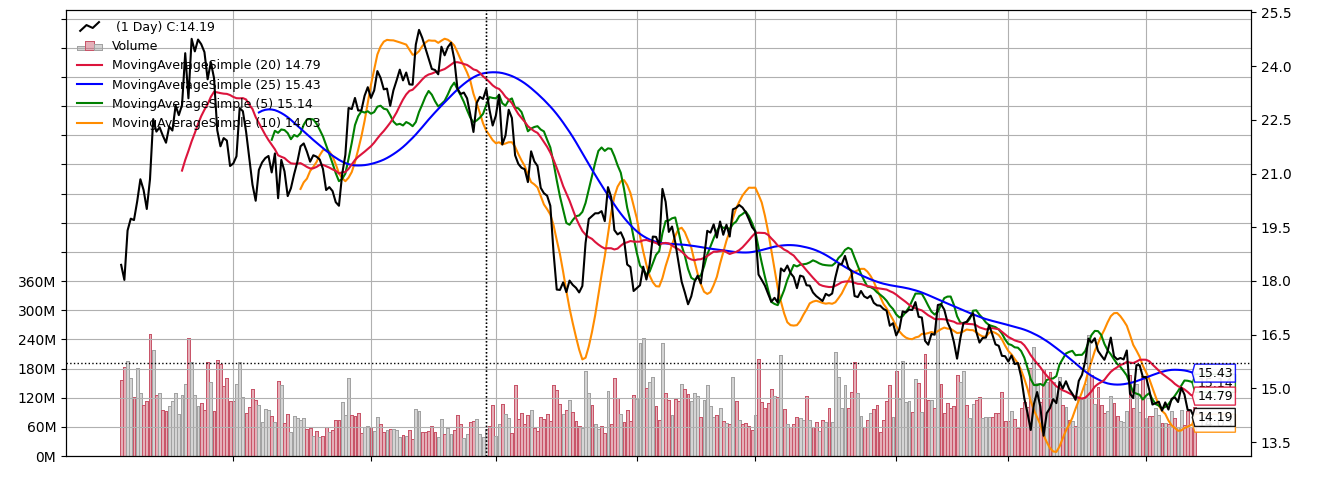
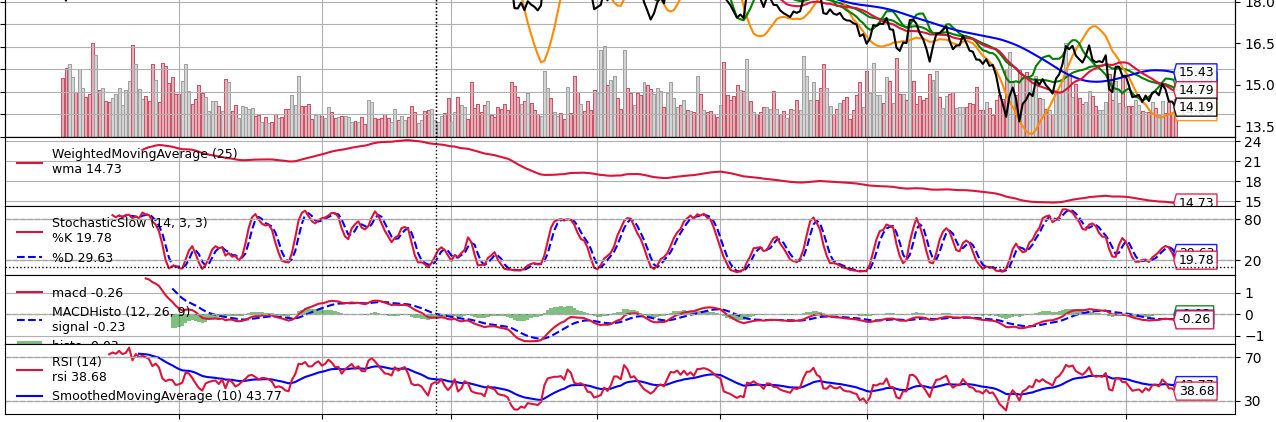
4.添加绘图指标
正常我们只需要在调用cerebro.run()后,再添加一行代码cerebro.plot(),就可以实现默认的图表展示。
现在我们要添加更多的绘图指标,怎么做?
除了默认显示的Broker,Trades,Volume,SMA等绘图指标,backtrader还添加了如下指标:
加权移动均值(WeightedMovingAverage)
慢速随机指标(StochasticSlow)
MACD
RSI
应用于RSI的简单移动均值(SimpleMovingAverage)
真实波动幅度均值(AverageTrueRange )
如果要显示,只需要在代码策略def __init__(self)中添加下面代码就可以
		# 绘图显示的指标
        bt.indicators.ExponentialMovingAverage(self.datas[0], period = 25)
        bt.indicators.WeightedMovingAverage(self.datas[0], period = 25,
                                            subplot = True)
        bt.indicators.StochasticSlow(self.datas[0])
        bt.indicators.MACDHisto(self.datas[0])
        rsi = bt.indicators.RSI(self.datas[0])
        bt.indicators.SmoothedMovingAverage(rsi, period = 10)
        bt.indicators.ATR(self.datas[0], plot = False)
添加后的图表展示:
5.绘图报错
可能在backtrader回测添加绘图cerebro.plot()时,会碰到这个错误:
遇到 ImportError: cannot import name ‘warnings‘ from ‘matplotlib.dates‘
如果碰到也不用过于担心,可以根据报错信息,找到对应报错文件,进行修改
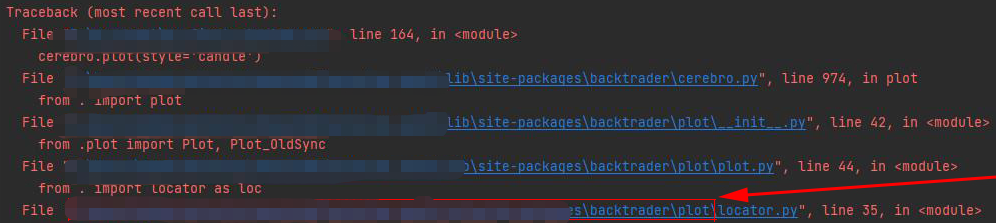
打开locator.py文件按以下修改:
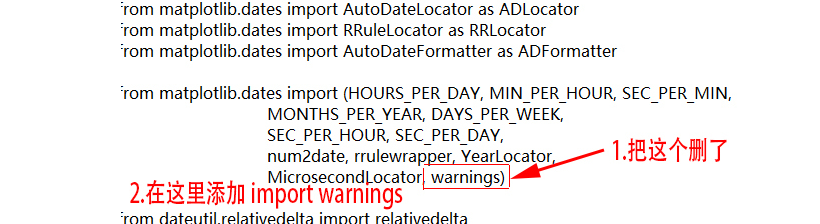
再次运行程序,就能正常展示绘图了。
总结
有些技能要点,实际回测中不常用到的可以先不用细看,知道有这么回事就知道,待实际需要用到再细嚼。