Python绘制节点是饼状图的社交网络图(Plot network with pie chart)
目录
问题描述
专业描述:想要绘制一幅社交网络图,并且每个节点上绘制一个饼状图。
大白话:韩韩(楼主)有一天突发奇想,想要画一张图,可以一目了然的展现好友关系以及不同好友的各项兴趣爱好。
问题拆解
数据准备
原始CSV数据下载链接:
链接:https://pan.baidu.com/s/1LuNH-6YDsoyGqqJL2JbKYA
提取码:7as7
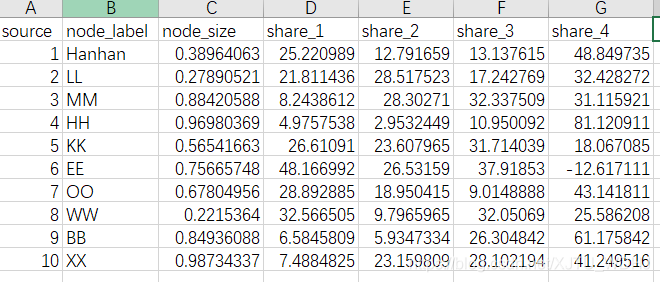
好友名单以及兴趣爱好表(表名为:friend_node.csv)。
这里的source就是代表楼主和楼主的朋友们,node_label表示楼主及朋友们的名称。node_size表示楼主和朋友们的相对身高或者balabalaa,任意代表个人属性的性质。share1-shre4表示楼主及朋友们在摄影、游泳、做饭、瑜伽这四项兴趣爱好的相对时间分布情况,这四项相加为100。

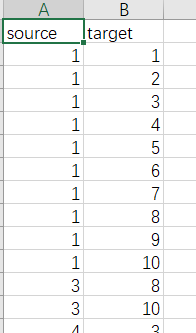
楼主与好友的关系表。(表名为:friend_edge.csv)
这里的source和target分别表示楼主和朋友们,比如(1,2)就表示楼主和LL是好朋友。

绘图思路
用Gephi其实可以做出漂亮的network图,但是楼主还需要在每个node上添加代表不同朋友的兴趣的属性,Gephi暂时还实现不了。就转战python。
绘制思路其实分为如下几步:
- 提取数据,用python从CSV文件中提取node和edge的数据。现实分析问题时,大都需要处理大量的数据,所以楼主附上此步的code,对python小白来说非常友好。(此处需点赞!!!)
- 选取绘制网络图的package,python中有多个package均可实现绘制网络图,如NetworkX、PyVis、Visdcc in Dash。(详细请阅读:https://towardsdatascience.com/visualizing-networks-in-python-d70f4cbeb259)。楼主选取的是networkX包,(这可能就是第一眼就喜欢上的package,呸,瞎说,第一眼搜到的package)。这个包可以整体绘制网络图、也可以将node,edge分次绘制。就类似ps的图层概念,一层一层画,叠加起来,顺着这个思路,要实现目的,就可以先绘制出edge,然后在每个node的位置绘制上pie图。之后再补充细节,如添加node的label等。
代码实现
# -*- coding: utf-8 -*-
"""
Created on Sun Jun 20 23:21:27 2021

@author: HJ
"""
##############################################################################
import csv
import numpy as np
import networkx as nx
import matplotlib.pyplot as plt


##############################################################################
################################# 数据提取 ####################################
##############################################################################
######读取node的表头
with open('friend_node.csv', 'r', encoding='UTF-8') as nodecsv: # Open the file
    reader=csv.reader(nodecsv)
    header_row=next(reader)
for index,column_header in enumerate(header_row):
    print(index,column_header)

######提取node表
with open('friend_node.csv', 'r', encoding='UTF-8') as nodecsv: # Open the file
    nodereader = csv.reader(nodecsv) # Read the csv 不读表头
    nodes = [n for n in nodereader][1:]
print(nodes)
node_names  = [n[0] for n in nodes]

###定义node的weight
node_weight = [n[2] for n in nodes]

#由于这样定义的node weigt是文本格式,所以将文本转化为数值
node_weight = np.array(node_weight)
print("node weight", node_weight)
node_weight_float = [ float(x) for x in node_weight ]
max_node_weight = max(node_weight_float)
min_node_weight = min(node_weight_float)


#定义node 的label
node_label = [n[1] for n in nodes]

#将node的属性以字典的形式储存
temp_attrs = [n[3:7] for n in nodes] #这里储存的信息是为了画pie图
attrs = dict(zip(node_names,temp_attrs)) #组成字典
print(attrs)

######读取edge表
with open('friend_edge.csv', 'r', encoding='UTF-8') as edgecsv: # Open the file
    edgereader = csv.reader(edgecsv) # Read the csv
    edges_all = [tuple(e) for e in edgereader][1:] # Retrieve the data
print(edges_all)
edges = [i[0:2][::-1] for i in edges_all] #提取前两列的数据
print(edges)

##############################################################################
################################# 绘制network ################################
##############################################################################
######设置画布大小,数值越大,后面画的像素越高、越清晰
plt.figure(4,figsize=(50,40))
###### make graph
G = nx.DiGraph() #这里一定要选择有向图,后面才可以画出curve
G.add_nodes_from(node_names,weight = node_weight )  #添加节点
G.add_edges_from(edges) #添加边

#######确定布局方式
pos = nx.spring_layout(G,k=1/3.3,scale=6,seed = 10,weight='weight')
'''
参数解释:
#k值决定了节点之间的距离,默认的设定是1/sqrt(n),n是节点数量。
    一般情况下,当k<1时,节点多集中在圆心内; 当k>1时,节点向圆周分布
#scale值会同比例的放大或者缩小节点的相对位置,scale<1,画面越挤;scale>1,画面越分散。
#seed,固定初始的随机数的位置,若不固定,每次画出的图布局都不一样,原理是
    spring_layout这种布局算法会初始先随机找一个点,然后通过不断的迭代对点的位置进行优化。
'''
######显示网络图的基本属性
density = nx.density(G)
print("Network density:", density)

######绘制节点的label
node_labels = dict(zip(G.nodes,node_label))
nx.draw_networkx_labels(G, pos=pos, labels = node_labels, font_size=50,alpha=0.98 )
'''
这里font_size决定了node label 的大小
alpha 的大小决定了label的透明度
'''
######绘制edge
nx.draw_networkx_edges(G,edge_color='gray', arrowsize = 5,  width=0.8, pos=pos, connectionstyle='arc3,rad=0.2')#在这里添加属性,添加颜色和大小
print(nx.info(G))
'''
arrowsize表示有向图里边的箭头的大小
connectionstyle='arc3,rad=0.2':其实设置的边的弧度,绘制出曲线,默认是直线
'''
######绘制pie图
#设置pie图里每个扇形的颜色
colors = ['orangered', 'dodgerblue', 'gold',  'darkseagreen']
#设置pie图的legend的label
labels1 = [u'Photography',u'Swimming',u'Cooking',u'Yoga'] #定义标签

b = -1
for node in G.nodes:
    attributes = attrs[node]
    attribute_float = list(map(lambda x:float(x), attributes))
    b = b + 1
    current_radius = (node_weight_float[b] - min_node_weight)*0.5/(max_node_weight-min_node_weight) + 0.2
    '''
        node的weight,这里设置一个线性函数,调整node size的相对大小,并将该数值赋值给pie图的半径
    '''
    a = plt.pie(
        attribute_float, #
        center=pos[node],  #pie图的位置就是node的位置
        labels=labels1, #给pie图添加label,由于所有pie图的label是一致的,所以只需绘制一次legend即可
        colors = colors ,
        pctdistance = 0.6,
        textprops = { 'fontsize':0}, #set label fontsize to zero so it won't show
        radius=current_radius, #调整pie图的半径
        wedgeprops={'alpha':0.9}) #调整透明度
    if b == 0: # only draw legend once
        plt.legend(loc='upper right', prop={'size': 50})

###设置坐标轴
'''
坐标轴的大小一定要和网络图匹配,否则会导致一些node,edge或者node label 显示不出来
'''
plt.ylim(-9.5,8)
plt.xlim(-9,11)

###保存图片
plt.savefig('friend.png') #一定放在plt.show()之前
plt.show()
总结
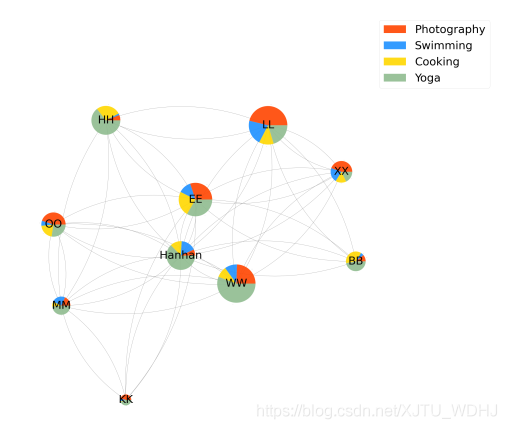
成图

最终的图片是不是超美!!!不接受反驳~
network 性质
以下是该网络的一些基本性质,如节点个数是10个,共有50条边,平均入度是5,出度也是5。
print(nx.info(G))
Name:
Type: DiGraph
Number of nodes: 10
Number of edges: 50
Average in degree: 5.0000
Average out degree: 5.0000
参考
以下代码参考链接:(楼主为了绘制此图,搜索了n多链接,累的快要吐血,最终筛选如下有用的几个链接)
- networkX包的官方说明文件,请务必详读!!!https://networkx.org/documentation/stable/reference/generated/networkx.drawing.layout.spring_layout.html;
- 绘制pie图的参考文件 :https://matplotlib.org/stable/api/_as_gen/matplotlib.pyplot.legend.html
- 一些其他参考:https://blog.csdn.net/u012111465/article/details/72797032
原创不易,觉得有用请点赞收藏转发。多谢!!!
完结,撒花~