Go pprof 使用记录
Golang自带的一款开箱即用的性能监控和分析工具。真正分析时常用4种
- CPU Profiling:CPU 分析,按照一定的频率采集所监听的应用程序 CPU(含寄存器)的使用情况,可确定应用程序在主动消耗 CPU 周期时花费时间的位置
- Memory Profiling:内存分析,在应用程序进行堆分配时记录堆栈跟踪,用于监视当前和历史内存使用情况,以及检查内存泄漏
- Block Profiling:阻塞分析,记录 goroutine 阻塞等待同步(包括定时器通道)的位置
- Mutex Profiling:互斥锁分析,报告互斥锁的竞争情况
做性能分析,第一步需要先获取数据,然后对数据进行分析。所以下面展示一下如何进行数据获取。
一、数据采集
1.1 runtime/pprof
手动调用 runtime.StartCPUProfile / runtime.StopCPUProfile 等API来进行数据的采集。
优点:灵活性高、按需采集。
使用场景:工具型应用(比如说定制化的分析小工具、集成到公司监控系统)
package main

import (
	"fmt"
	"os"
	"runtime/pprof"
)

func sayHelloWorld() {
	var list []string
	for i := 0; i < 100; i++ {
		list = append(list, "Hello World")
	}
	fmt.Println(list)
}

func main() {
	//CPU Profile
	fc, err := os.Create("./cpu.prof")
	if err != nil {
		fmt.Println(err)
		return
	}
	defer fc.Close()
	pprof.StartCPUProfile(fc)
	defer pprof.StopCPUProfile()

	//Memory Profile
	fm, err := os.Create("./mem.prof")
	if err != nil {
		fmt.Println(err)
		return
	}
	defer fm.Close()
	pprof.WriteHeapProfile(fm)

	sayHelloWorld()
}
执行命令:go run pprof.go 然后会得到数据采集文件:cpu.prof 和 mem.prof (后边分析会用到)。
1.2 http方式采集(net/http/pprof)
通过 http 服务来获取 Profile 采样文件。 import _ "net/http/pprof"
优点:简单易用。
使用场景:在线服务(一直运行着的程序)
( net/http/pprof 中只是使用 runtime/pprof 包来进行封装了一下,并在http端口上暴露出来)
package main

import (
	"fmt"
	"net/http"
	_ "net/http/pprof"
	"strings"
)

func helloServer(w http.ResponseWriter, r *http.Request) {
	r.ParseForm()       //解析参数,默认是不会解析的
	fmt.Println(r.Form) //这些信息是输出到服务器端的打印信息
	fmt.Println("path", r.URL.Path)
	fmt.Println("scheme", r.URL.Scheme)
	fmt.Println(r.Form["url_long"])
	for k, v := range r.Form {
		fmt.Println("key:", k)
		fmt.Println("val:", strings.Join(v, ""))
	}
	fmt.Fprintf(w, "Hello World!")
}

func main() {
	http.HandleFunc("/", helloServer)        //设置访问的路由
	err := http.ListenAndServe(":8080", nil) //设置监听的端口
	if err != nil {
		fmt.Printf("ListenAndServe: %s", err)
	}
}
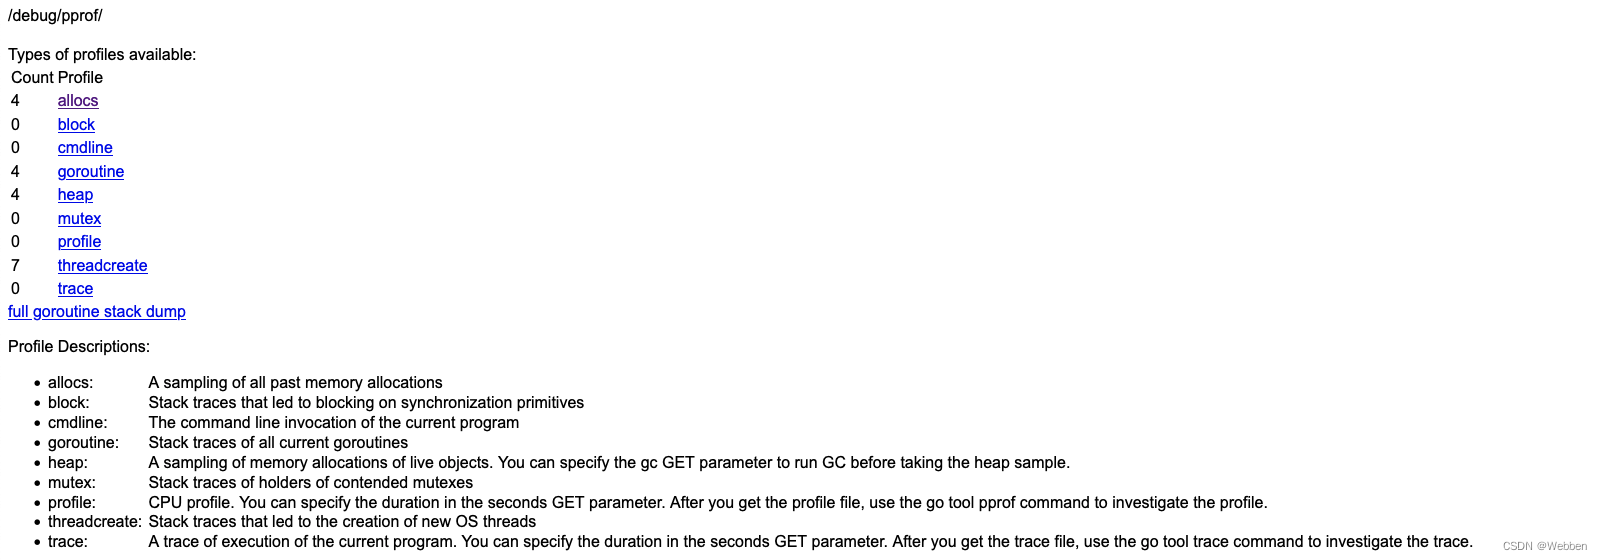
执行 go run main.go 服务启动以后就可以访问 http://127.0.0.1:8080/debug/pprof/ 查看到数据了,如图:
1.3 go test
通过命令 go test -bench . -cpuprofile cpu.prof 来进行采集数据。
优点:针对性强、细化到函数
使用场景:进行某函数的性能测试
二、数据内容
不管是前文哪种方式获取,都可以进行分析。这里http的方式把可以看到的信息全部都列出来了。
| 类型 | 描述 |
|---|---|
| allocs | 内存分配情况的采样信息 |
| blocks | 阻塞操作情况的采样信息 |
| cmdline | 显示程序启动命令参数及其参数 |
| goroutine | 显示当前所有协程的堆栈信息 |
| heap | 堆上的内存分配情况的采样信息 |
| mutex | 锁竞争情况的采样信息 |
| profile | cpu占用情况的采样信息,点击会下载文件 |
| threadcreate | 系统线程创建情况的采样信息 |
| trace | 程序运行跟踪信息 |
三、数据分析
虽然我们生成了数据,这些数据可以存储到文件里、也可以展示在浏览器中。
但是直接访问这些性能分析数据,我们是分析不过来什么的。Go在 1.11 版本后在它自带的工具集 go tool 里内置了 pprof 工具来分析由pprof库生成的数据文件。
使用 go tool pprof 分析数据,主要有两种写法:
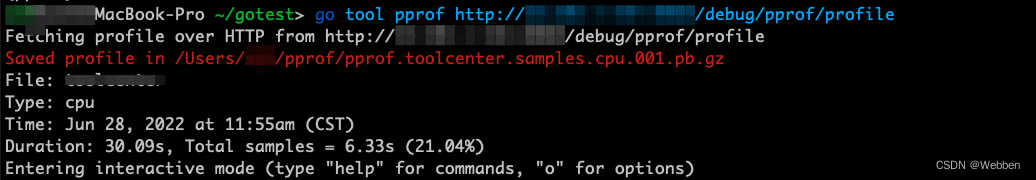
- 通过路径,如
go tool pprof http://localhost:8080/debug/pprof/profile(进入命令行交互模式) - 通过下载的文件,如
go tool pprof cpu.prof(进入命令行交互模式)或者go tool pprof -http=:8081 cpu.prof(进入web页面)
进入命令行交互模式后,可以使用 help 查看所有子命令,使用 help <cmd|option> 查看子命令使用方法。
top 列出最耗时的地方
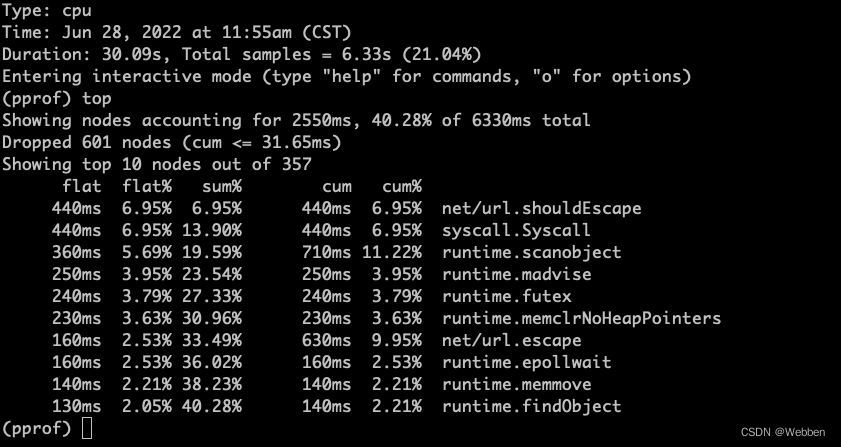
| 类型 | 描述 | 举例 |
|---|---|---|
| flat | 该函数占用CPU的耗时 | net/url.shouldEscape 占用CPU的耗时是440ms |
| flat% | 该函数占用CPU的耗时的百分比 | net/url.shouldEscape 耗时:440ms,cpu总耗时:6330ms,440ms/6330ms=6.95% |
| sum% | top命令中排在它上面的函数以及本函数flat%之和 | runtime.scanobject:6.95%+6.95%+5.69%=19.59% |
| cum | 当前函数加上该函数调用之前的累计CPU耗时 | 应该大于等于flat |
| cum% | 当前函数加上该函数调用之前的累计CPU耗时的百分比 | 应该大于等于flat% |
| 最后一列 | 当前函数名称 |
发现flat越大代表越有问题耗时越高,越可能存在问题。发现 net/url.shouldEscape 函数有点问题。此时通过命令:list net/url.shouldEscape,来进行查看具体的位置(图下图)。
可视化页面
两种方式可以支持浏览器打开web站:
- 执行命令:
go tool pprof -http=:8081 cpu.prof - 或者在命令模式输入
web自动生成svg文件,并跳转到浏览器,依赖安装:https://www.graphviz.org/download/source/。
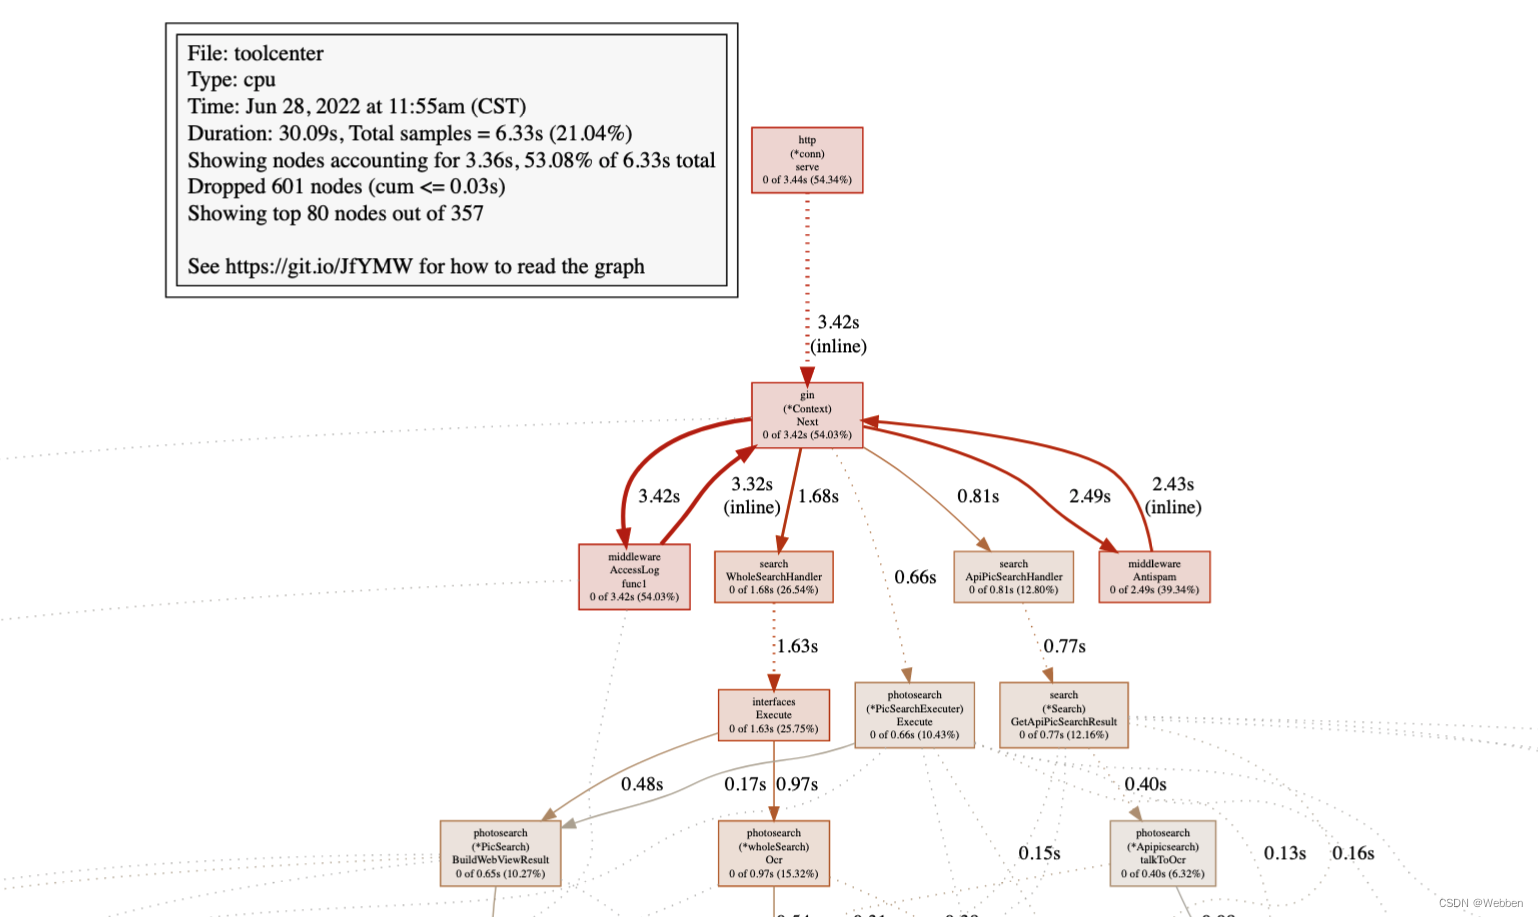 左上角方框内数据:表示显示的为cpu的画像。显示的节点在总共30.09s的抽样中,占6.33s,比例为 21.04%。
图中每个方框对应应用程序运行的一个函数,方框越大代表函数执行的时间越久(函数执行时间会包含它调用的子函数的执行时间,但并不是正比的关系);方框之间的箭头代表着调用关系,箭头上的数字代表被调用函数的执行时间。具体细节可以参考:https://github.com/google/pprof/tree/master/doc#interpreting-the-callgraph
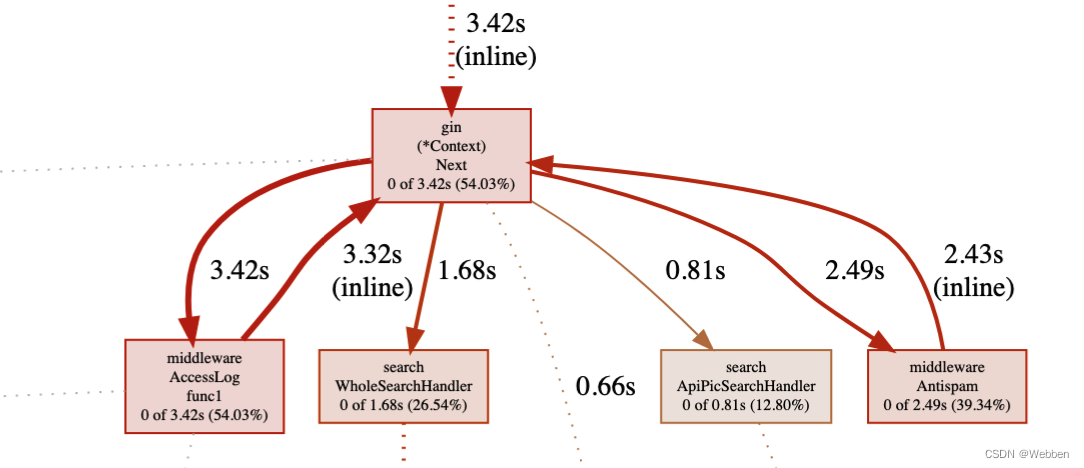
方框中显示的时间为总时间,gin(*Context)Next 的总执行时间为 3.42s,总时间占比为54.03%,只算函数自身执行时间为3.42s。
通过函数调用图,可以很直观的看出哪个函数耗时严重。
分析函数代码
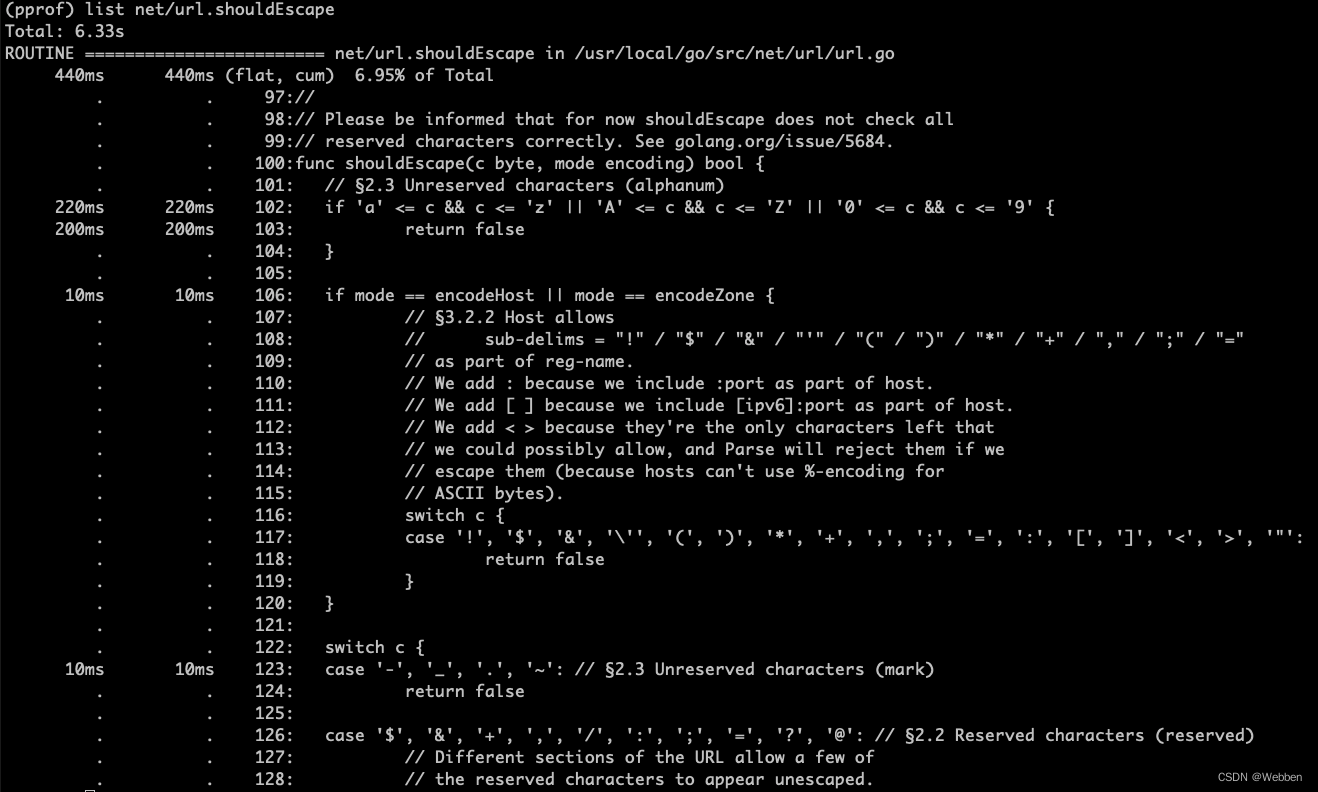
当确定出哪个函数耗时之后,可以用pprof分析函数中的哪一行导致的耗时,使用子命令:list 函数名。
(pprof) list net/url.shouldEscape
Total: 6.33s
ROUTINE ======================== net/url.shouldEscape in /usr/local/go/src/net/url/url.go
     440ms      440ms (flat, cum)  6.95% of Total
         .          .     97://
         .          .     98:// Please be informed that for now shouldEscape does not check all
         .          .     99:// reserved characters correctly. See golang.org/issue/5684.
         .          .    100:func shouldEscape(c byte, mode encoding) bool {
         .          .    101:	// §2.3 Unreserved characters (alphanum)
     220ms      220ms    102:	if 'a' <= c && c <= 'z' || 'A' <= c && c <= 'Z' || '0' <= c && c <= '9' {
     200ms      200ms    103:		return false
         .          .    104:	}
         .          .    105:
      10ms       10ms    106:	if mode == encodeHost || mode == encodeZone {
         .          .    107:		// §3.2.2 Host allows
         .          .    108:		//	sub-delims = "!" / "$" / "&" / "'" / "(" / ")" / "*" / "+" / "," / ";" / "="
         .          .    109:		// as part of reg-name.
         .          .    110:		// We add : because we include :port as part of host.
         .          .    111:		// We add [ ] because we include [ipv6]:port as part of host.
         .          .    112:		// We add < > because they're the only characters left that
         .          .    113:		// we could possibly allow, and Parse will reject them if we
         .          .    114:		// escape them (because hosts can't use %-encoding for
         .          .    115:		// ASCII bytes).
         .          .    116:		switch c {
         .          .    117:		case '!', '$', '&', '\'', '(', ')', '*', '+', ',', ';', '=', ':', '[', ']', '<', '>', '"':
         .          .    118:			return false
         .          .    119:		}
         .          .    120:	}
         .          .    121:
         .          .    122:	switch c {
      10ms       10ms    123:	case '-', '_', '.', '~': // §2.3 Unreserved characters (mark)
         .          .    124:		return false
         .          .    125:
         .          .    126:	case '$', '&', '+', ',', '/', ':', ';', '=', '?', '@': // §2.2 Reserved characters (reserved)
         .          .    127:		// Different sections of the URL allow a few of
         .          .    128:		// the reserved characters to appear unescaped.
可以看出,对于 net/url.shouldEscape 函数,耗时的位置主要在第 102 行,字符串比较的操作。
Memory Profiling
同CPU操作
使用profile可以获取很多重要信息,cpu profiling、memory profiling使用也是最频繁的。分析的时候,需要先获取到数据,通过web发现耗时的函数,然后通过list找到具体位置。
其它的数据的分析和CPU、Memory基本一致。下面列一下所有的数据类型:
| 操作 | 说明 |
|---|---|
| http://localhost:8082/debug/pprof/ | 获取概况信息,即图一的信息 |
| go tool pprof http://localhost:8082/debug/pprof/allocs | 分析内存分配 |
| go tool pprof http://localhost:8082/debug/pprof/block | 分析堆栈跟踪导致阻塞的同步原语 |
| go tool pprof http://localhost:8082/debug/pprof/cmdline | 分析命令行调用的程序,web下调用报错 |
| go tool pprof http://localhost:8082/debug/pprof/goroutine | 分析当前 goroutine 的堆栈信息 |
| go tool pprof http://localhost:8082/debug/pprof/heap | 分析当前活动对象内存分配 |
| go tool pprof http://localhost:8082/debug/pprof/mutex | 分析堆栈跟踪竞争状态互斥锁的持有者 |
| go tool pprof http://localhost:8082/debug/pprof/profile | 分析一定持续时间内CPU的使用情况 |
| go tool pprof http://localhost:8082/debug/pprof/threadcreate | 分析堆栈跟踪系统新线程的创建 |
| go tool pprof http://localhost:8082/debug/pprof/trace | 分析追踪当前程序的执行状况 |