Matplotlib学习笔记(五)subplot方法
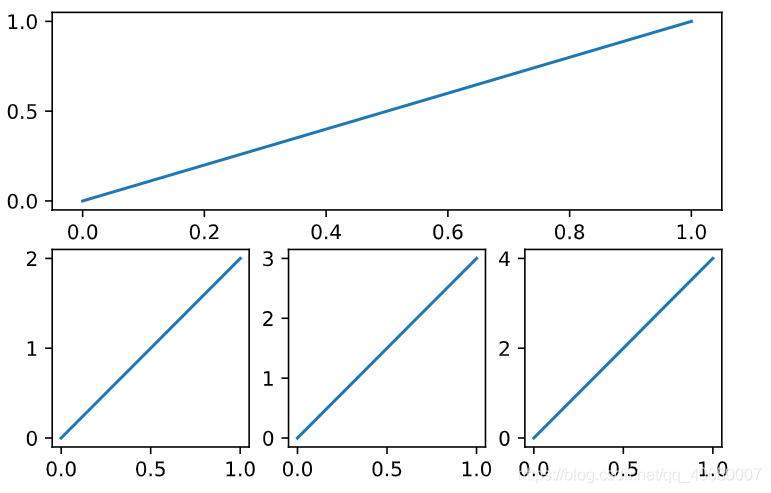
一、subplot多合一显示
代码如下:
import matplotlib.pyplot as plt
plt.figure()

plt.subplot(2, 1, 1) # 两行一列 位置一
plt.plot([0, 1], [0, 1])

plt.subplot(2, 3, 4) # 两行三列 位置四
plt.plot([0, 1], [0, 2])

plt.subplot(2, 3, 5) # 两行三列 位置五
plt.plot([0, 1], [0, 3])

plt.subplot(2, 3, 6) # 两行三列 位置六
plt.plot([0, 1], [0, 4])

plt.show()
显示结果:
二、subplot分格显示
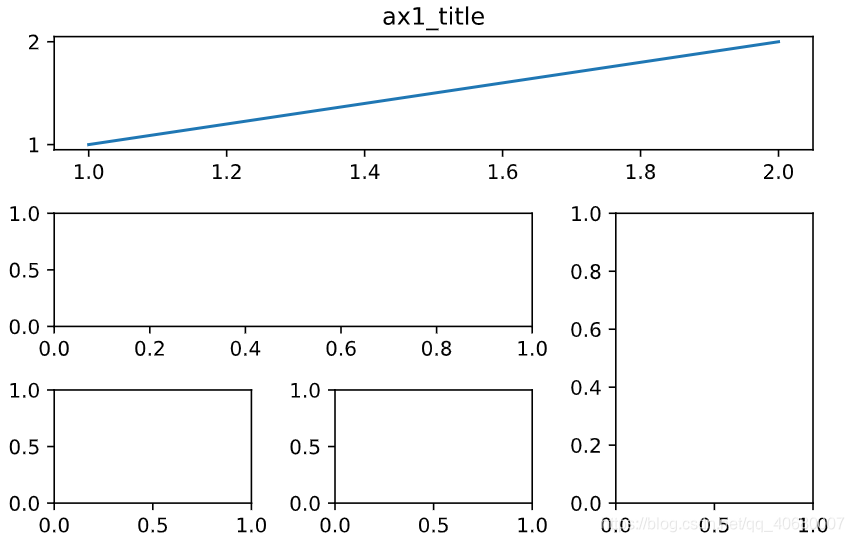
方法一:subplot2grid
代码如下:
import matplotlib.pyplot as plt
plt.figure()
"""
(3,3)表示将整个图像窗口分成3行3列, (0,0)表示从第0行第0列开始作图,colspan=3表示此图跨3列, rowspan=1表示行的跨度为1. colspan和rowspan默认跨度为1且为缺省值.
"""
ax1 = plt.subplot2grid((3, 3), (0, 0),colspan=3, rowspan=1)
ax1.plot([1, 2], [1, 2])  # 第一个小图两个点连线,x为1和1,y与之对应的为2和2
ax1.set_title("ax1_title") # 设置第一个小图的标题

ax2 = plt.subplot2grid((3, 3), (1, 0),colspan=2)
ax3 = plt.subplot2grid((3, 3), (1, 2),rowspan=2)
ax4 = plt.subplot2grid((3, 3), (2, 0))
ax1 = plt.subplot2grid((3, 3), (2, 1))


plt.tight_layout() # tight_layout()函数 会自动调整子图参数,使之填充整个图像区域
plt.show()
结果显示:
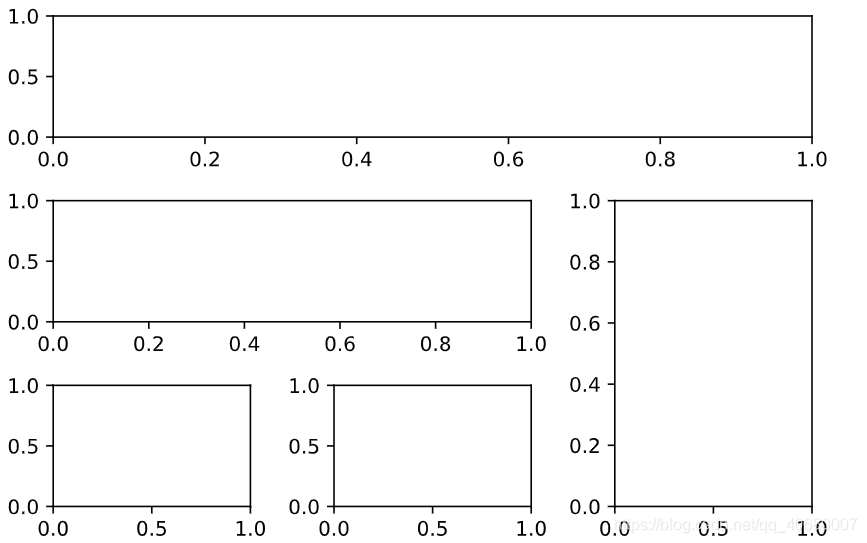
方法二:gridspec
代码如下:
import matplotlib.pyplot as plt
import matplotlib.gridspec as gridspec
plt.figure()
gs = gridspec.GridSpec(3,3) # 将窗口分为三行三列

ax1 = plt.subplot(gs[0, :]) # 第一个图占据第一行的所有列
ax2 = plt.subplot(gs[1, :2]) # 第二个图占据第二行前两列
ax3 = plt.subplot(gs[1:, 2]) # 第三个图为第三列从第二行以后的行数
ax4 = plt.subplot(gs[-1, 0]) # 第四个图为倒数第一行的第一列
ax5 = plt.subplot(gs[-1, -2]) # 第五个图为倒数第一行的倒数第二列

plt.tight_layout() # tight_layout()函数 会自动调整子图参数,使之填充整个图像区域
plt.show()
显示结果:
方法三:定义简单结构
代码如下:
import matplotlib.pyplot as plt
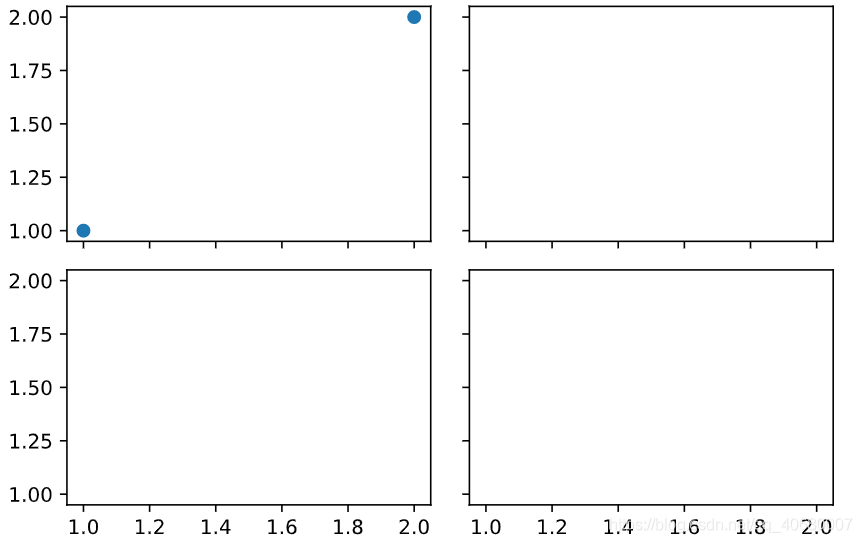
# 建立一个2行2列的图像窗口,sharex=True表示共享x轴坐标, sharey=True表示共享y轴坐标.
# ((ax11, ax12), (ax13, ax14))表示第1行从左至右依次放ax11和ax12, 第2行从左至右依次放ax13和ax14.
f, ((ax11, ax12), (ax21, ax22)) = plt.subplots(2, 2,sharex = True, sharey = True)
ax11.scatter([1, 2], [1,2]) # 散点图两个点(1,1),(2,2)

plt.tight_layout()
plt.show()
结果显示: