python将BGR图像转直方图后再滤波示例
可以使用numpy中的convolve函数来实现一维滤波,以下是一个可以指定核大小的函数:
import numpy as np

def one_dim_filter(arr, kernel_size):
    if kernel_size % 2 == 0:
        raise ValueError("Kernel size must be odd")
    kernel = np.ones(kernel_size) / kernel_size
    filtered_arr = np.convolve(arr, kernel, mode='same')
    return filtered_arr
该函数接受两个参数:待滤波的numpy数组和核大小。如果核大小为偶数,则会引发ValueError异常。函数会创建一个大小为kernel_size的均值滤波器,然后将其应用于输入数组arr。最后,使用’mode = same’来确保输出数组与输入数组的大小相同。
对如下的图片三通道的数据拉平后,的直方图数据,进行滤波实验
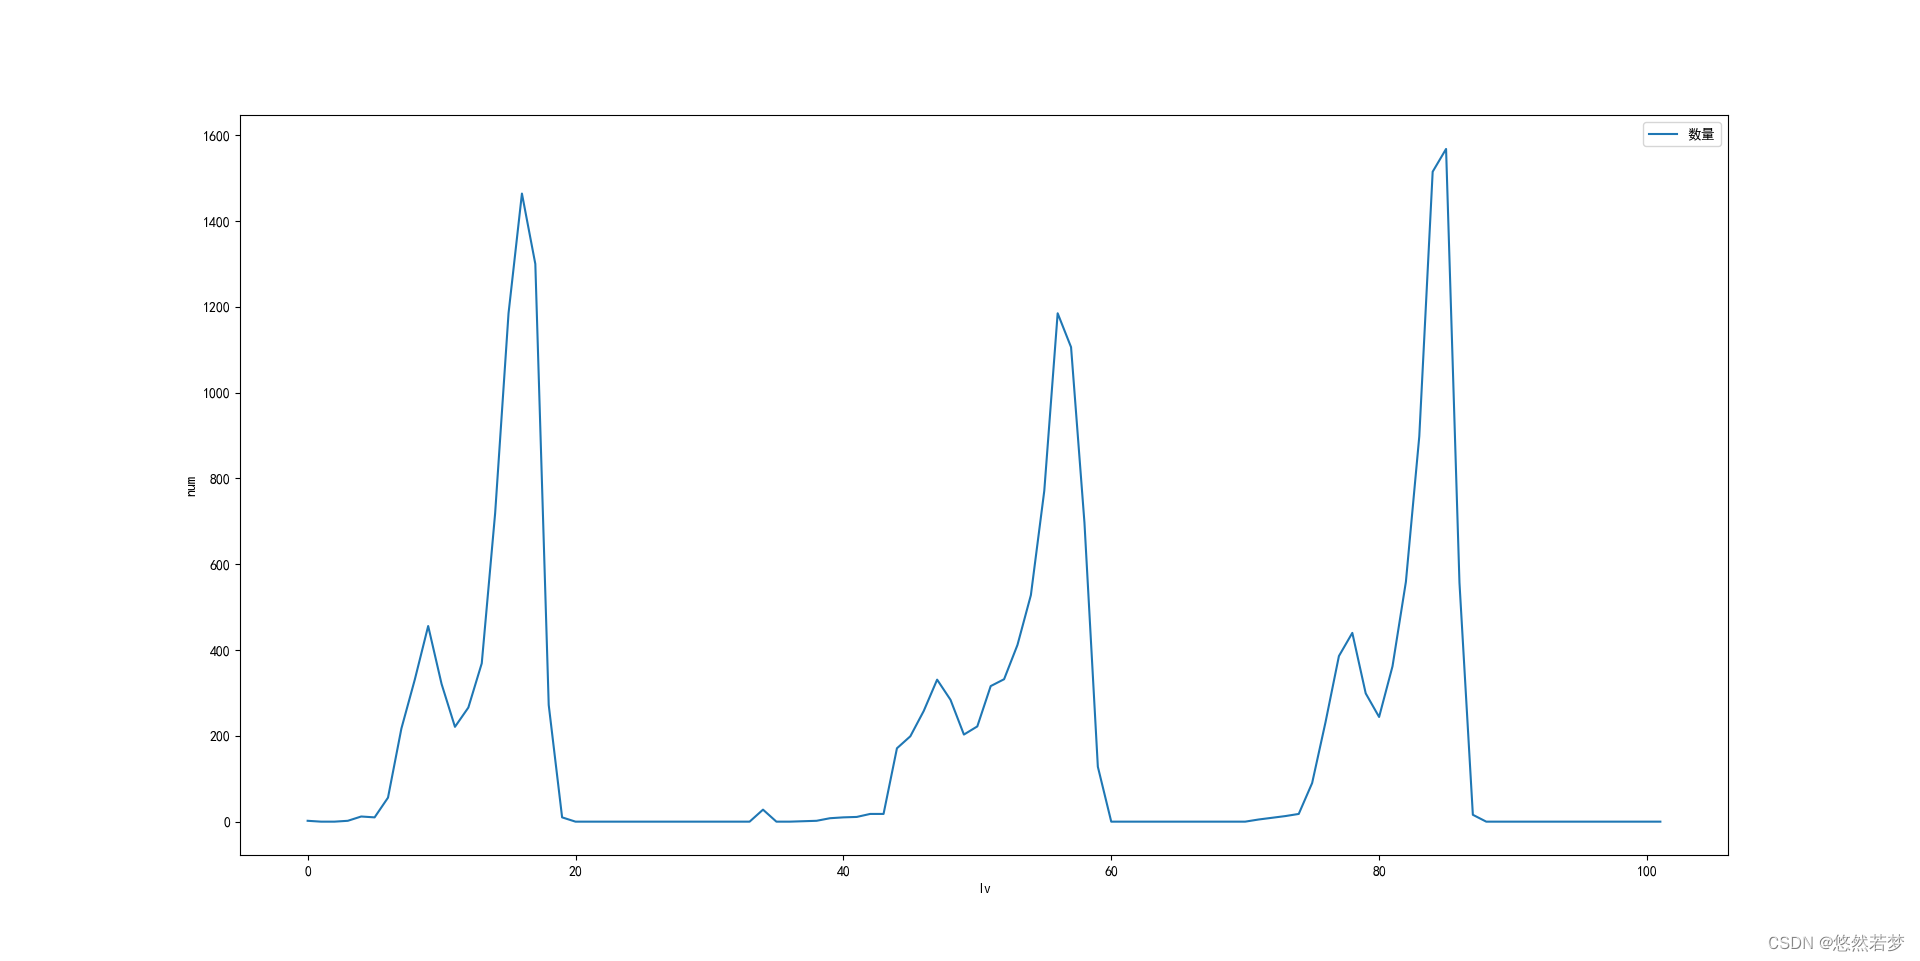
如下是未进行滤波的数据
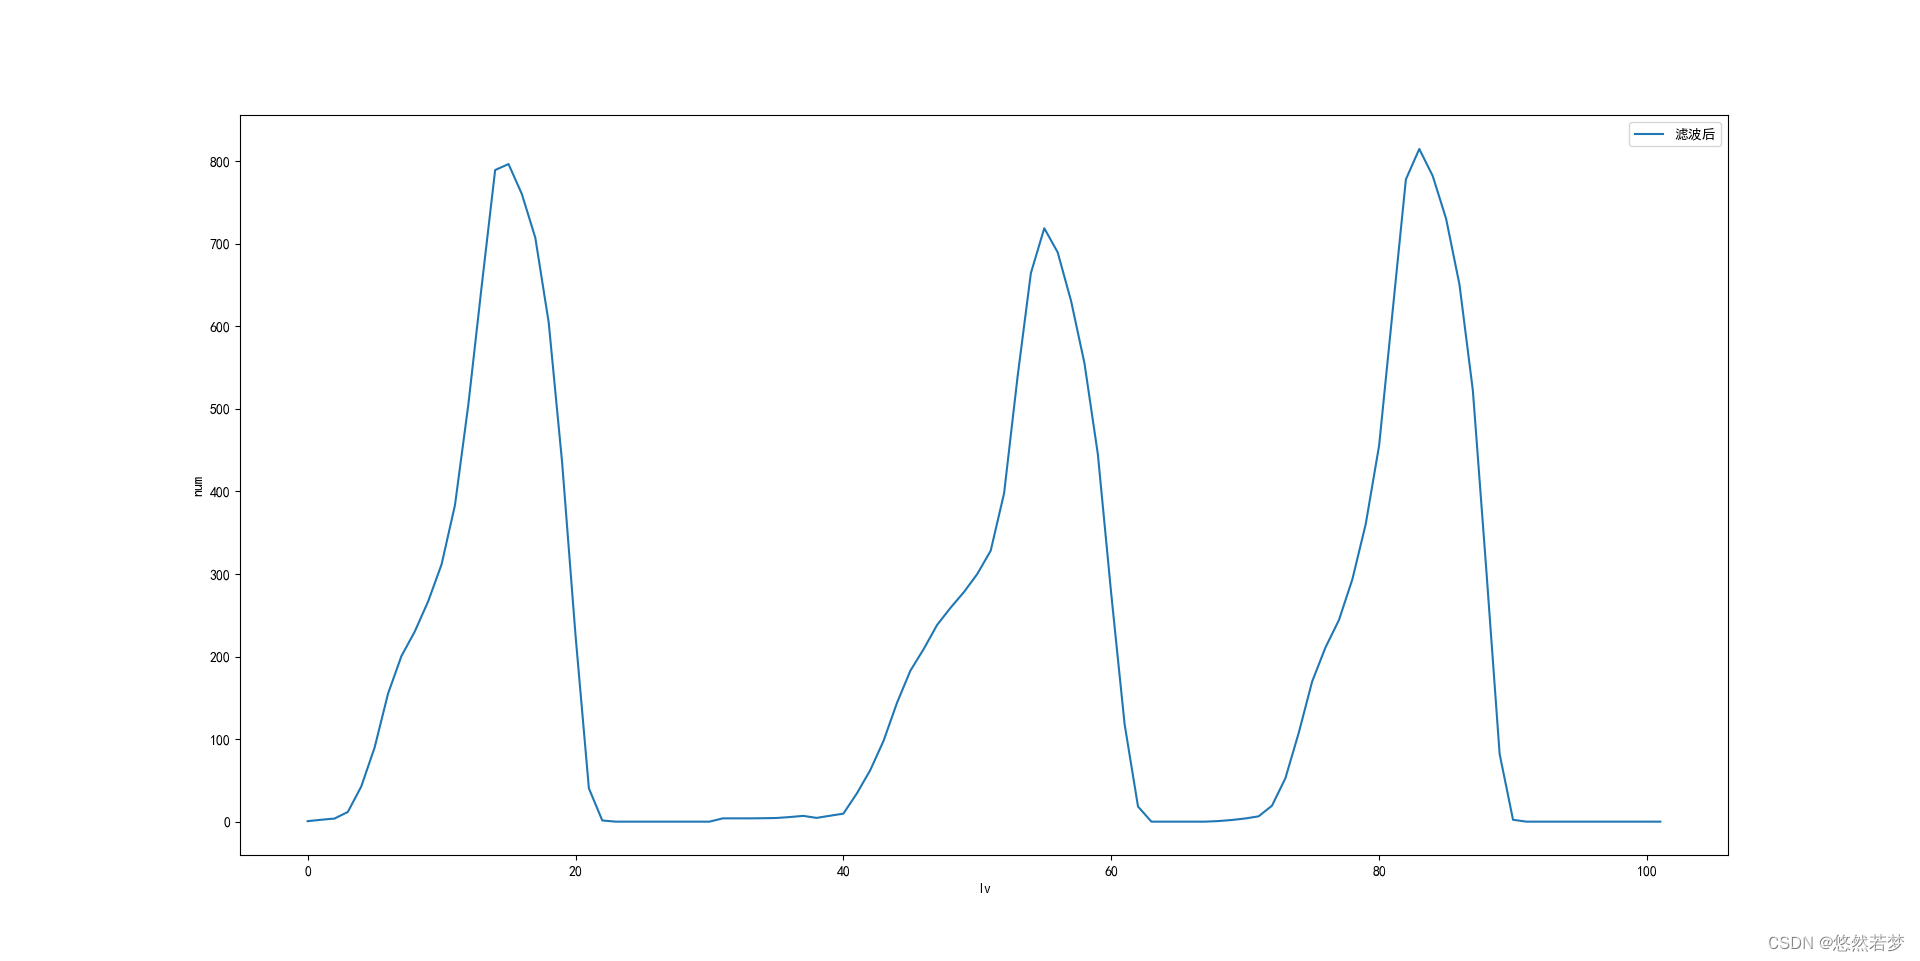
以下是滤波后的数据,明显数据变得平滑了许多,这里我是用的是7核
如下是实现计算直方图的函数
def calcHist(channel, levels, histogram_bins, Norm = False):
    # 将像素值映射到对应的直方图bin上
    bins = np.digitize(channel.ravel(), histogram_bins) - 1

    # 初始化直方图为0
    histogram = np.zeros(len(histogram_bins)-1)

    # 遍历所有像素,将像素值加入对应的直方图bin
    for i in range(len(bins)):
        histogram[bins[i]] += 1

    # 将直方图bin中的像素数量归一化到[0, 1]范围
    if Norm:
        histogram /= np.sum(histogram)
    return histogram[1:-1]
计算 BGR 图像直方图拉平后的函数
def extract_histogram(image, levels=256, color_space='BGR', histogram_type='count'):
    """
    Extracts histogram from the given image and returns the flattened histogram array.
    :param image: The input image.
    :param levels: Number of levels to use for each channel.
    :param color_space: Color space to use. Can be 'BGR' or 'GRAY'.
    :param histogram_type: Type of histogram to calculate. Can be 'count' or 'probability'.
    :return: Flattened histogram array.
    """
    if color_space == 'BGR':
        channels = cv2.split(image)
        histogram_bins = []
        for channel in channels:
            histogram_bins.append(np.linspace(0, 256, levels + 1))

        # Calculate histogram for each channel and concatenate them into one array
        channel_histograms = []
        for i, channel in enumerate(channels):
            if histogram_type == 'probability':
                channel_histogram = calcHist(channel, levels, histogram_bins[i], True)
            else:
                channel_histogram = calcHist(channel, levels, histogram_bins[i])

            channel_histograms.append(channel_histogram.flatten())
        histogram = np.concatenate(channel_histograms)

    elif color_space == 'GRAY':
        histogram_bins = np.linspace(0, 256, levels + 1)
        gray_image = cv2.cvtColor(image, cv2.COLOR_BGR2GRAY)
        histogram = cv2.calcHist([gray_image], [0], None, [levels], histogram_bins)
        if histogram_type == 'probability':
            histogram = cv2.normalize(histogram, None, alpha=0, beta=1, norm_type=cv2.NORM_MINMAX).flatten()
        else:
            histogram = histogram.flatten()

    return histogram
如下是具体对图像进行滤波的代码, 并绘图的代码
hist = tl1.extract_histogram(self.bgrs[0], 36)
tl1.plot_numpy_array(hist, 'lv', 'num', '数量')
# 7 是ksize
hist_f = tl1.one_dim_filter(hist, 7)
tl1.plot_numpy_array(hist_f, 'lv', 'num', '滤波后')
绘图函数如下
def plot_numpy_array(data, xlabel=None, ylabel=None, legend=None):
    x = np.arange(len(data))
    fig, ax = plt.subplots()
    ax.plot(x, data, label=legend)
    ax.set_xlabel(xlabel)
    ax.set_ylabel(ylabel)
    ax.legend()
    plt.show()